
“If I had an hour to solve a problem I’d spend 55 minutes thinking about the problem and 5 minutes thinking about the solution.”

Pretty smart advice from Albert Einstein. Too often we jump immediately into problem-solving mode without fully understanding the problem itself. Frequently a problem seems unsolvable because it is really multiple problems and each requires its own solution. A well-defined problem statement is objective and based in data. It presents the problem but not a cause or solution. It clearly defines a performance gap and focuses the team, and it can be understood by people who are not directly involved.
Well-written problem statements must be able to answer two questions.
Problem statements should:
Consider the following problem statements:
It is important that you do not confuse symptoms, problems, and causes. If you are feeling achy, weak, or tired, those are symptoms. But the problem may be that you have a fever, and the cause may be an infection.
Some problems quite obviously need to be solved, but others are not clear-cut. For instance, do you need to solve the “problem” that your company is losing 4% of a specific component to damage during warehouse handling and transit? That depends on several factors. Do not expect a problem statement to make its own case – it must be backed up with the reasons why the problem should be solved.
A frequent pitfall in problem solving is that the wrong problem – one that doesn’t matter or does not advance the organization’s strategic business plan – is solved. To make good decisions, you should think “business case” and examine problems with three things in mind:

In the problem statement example given above (hypodermic needles), the impact could be serious. If the inner diameter of the needles is too small, it could cause undesirable constriction. If it is too large, it might cause a patient’s blood pressure to drop.
In many situations the original problem statement might be quite broad, but “general” problems are very hard to solve and it’s even harder to measure your success in solving them. The better you define and focus the problem, the easier it will be to verify the solution. There are no rules that tell you when a problem is focused enough. Narrowing a problem allows you to localize the problem definition and use time and resources most efficiently. Developing a focused problem statement is a balancing act – you have to focus so that you have a clear path forward, but you don’t want to get bogged down.
Going back to the problem statement example concerning hypodermic needles, a more focused problem statement would read: Hypodermic needles, Gage 25, supplied by vendor A, lot #123, in October 2018, show too much variation in their inner diameter, beyond specification limits.
Once you have recognized a problem and determined it is worth addressing, you need to make a case for doing so. As we said before, many problems make their own case and it will be obvious to almost everyone that they should be solved. Sometimes, though, what may seem obvious to you could be viewed differently by others. Recognize the differing priorities of your internal audience in making your case. Engineers speak the language of measurement, while management speaks the language of money. For instance, you could say that a reduction in product defects by 50% will “reduce scrap, improve customer satisfaction, and reduce the labor needed for rework.” However, it will be much better if you make the case that doing so will “cut material costs by $275,000 per year, increase sales by 1-2%, and reduce labor costs by $150,000 per year.” That’s specific, measurable, and impactful. By crafting a clear problem statement and making a compelling business case, you can articulate how you will measure success.
After that, the next step is to prioritize the problems. Projects should be meaningful and manageable. To help evaluate them, create a matrix and weight the projects, as shown below.
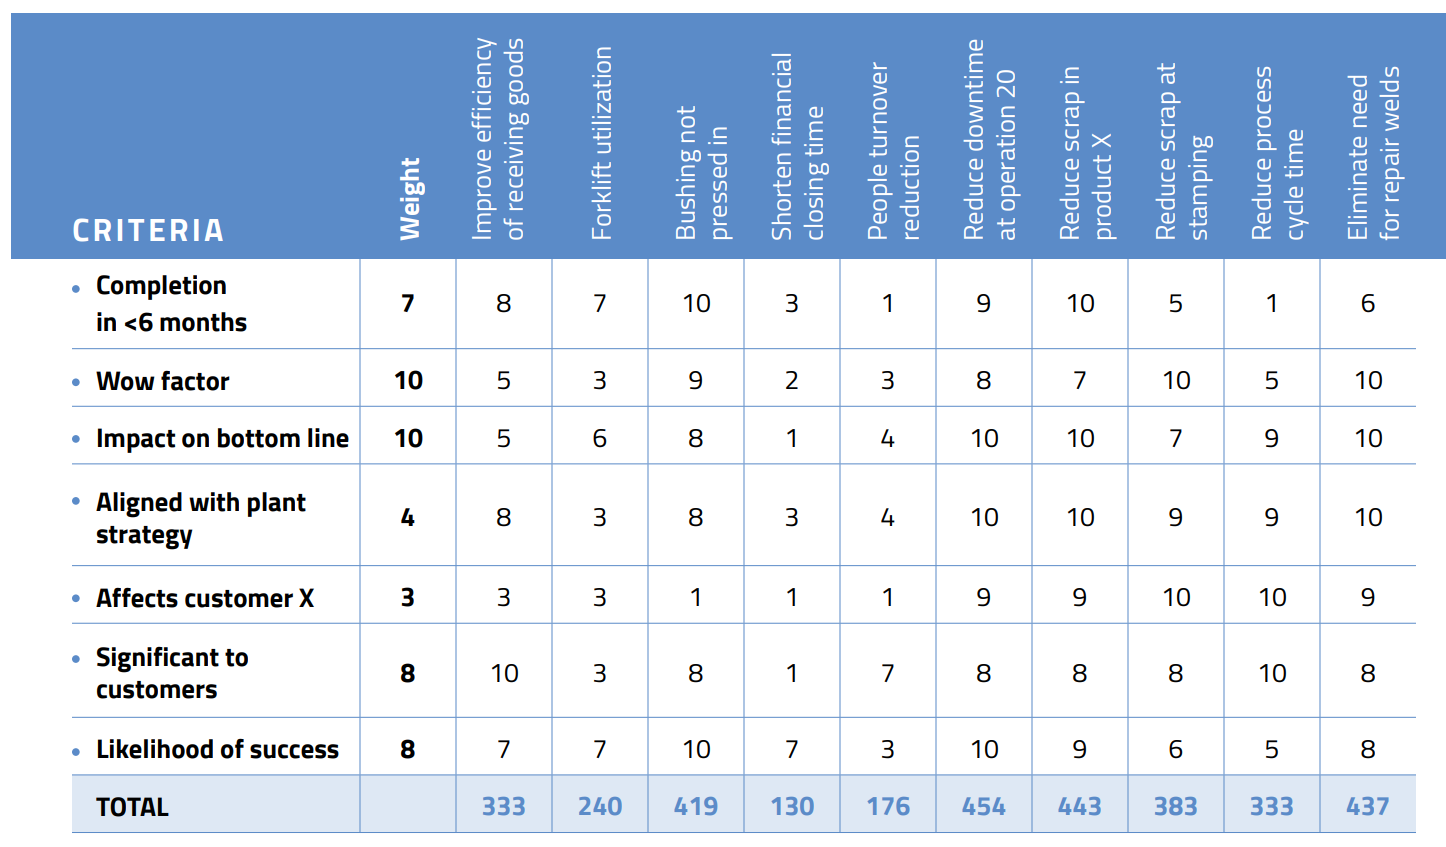
Remember, as amazing as you are, you are not a superhero. Success is measured by victories, not by the size and number of battles. It’s better to achieve success one small problem at a time than fight ongoing battles on multiple fronts. Doing so will also reduce your stress level and make your work more meaningful.

Now that you have convinced management that they should dedicate resources to solving a specific problem, it’s time to get started on solving it.
Woohoo, let’s go!
Not so fast…you’ll probably need some help.
First, it is important to recognize that problem solving is a project – that is, a temporary endeavor to accomplish a given goal. Second, finding the root cause of a problem typically requires a team. For example, a quality engineer assigned to lead the team may need assistance from Manufacturing and Engineering staff members, who usually are permanent team members. That said, permanent team members may need the assistance of others as the project evolves. An example would be support from statisticians related to applying statistical tools. This is where your sales skills come in. You need to convince management that there is a need for a team and supporting personnel. This will ensure the availability of resources to move the project along with a sense of urgency.
Very few problems are cast in stone from the beginning. Most projects evolve. During each phase of the problem-solving process you’ll learn more about what is really going on. With this in mind, you need to be open to revisiting the scope, definition, and purpose of the project. It is very tempting to want to jump directly into action. After all, you are paid to get results, not hold endless meetings to discuss taking action!
You should recognize that our innate bias toward action has pitfalls. Foremost among them is the fact that every specialist on your team will see a problem through his/her own lens. Regardless of whether your team will be around for 3 months or 3+ years, make sure it is cross-functional. You will need and want different points of view. Your team will likely have some strong personalities who will pontificate about probable causes with confidence, sometimes before you even have any data. As the leader, it is important that you listen and frame these theories as possible causes, not probable causes. Your ultimate goal is to refine and focus the problem, collect facts, develop probable causes, verify causes against the facts, and then divide and conquer.
With your team assembled, one of the first things you must define is what data you need to gather, and how you are going to capture and evaluate it. There may be some instances in which you will use historical data, and other instances in which you will need to collect data. Do not collect data under the false assumption that “more is better.” In problem solving, we sometimes grab all the data we can find in the hope that it will somehow lead to enlightenment. But if data is not collected specifically to resolve a problem, it simply wastes time and money. Ask your team which questions need answers and what data will provide those answers. The primary purpose of the data is to localize the problem. At some point you will need to decide whether the cost of obtaining more data and refining the focus is worth the investment.
It is important that before you look for data needed to address the problem, you write a specific, concrete, and measurable operational definition. You want to:
Probable causes are only as valid as the data that supports them. The data you use provides an agreed-on basis for decisions. The data should be understood by all who use it and cannot be “gamed” to support a specific agenda. It is important to objectively verify your sources of data. Here’s an example illustrating why.
Management wanted to improve the testing cycle times at its five test labs. The goal was to turn around 80% of all test results within 48 hours. After a few months, the results came in.

Wow, at first glance the data would seem to indicate that Lab B is not meeting expectations, right? Not so fast. It turns out that Lab B calculates their turnaround time based on the actual time samples arrive at their facility, even though samples always arrive late in the afternoon. The other four labs start the clock the next morning, when they actually start processing the samples – on average, nearly 16 hours later than Lab B. After Lab B applied the same rules being used by other labs, their performance jumped to 77%.
When evaluating data, embrace the proverb:
“Trust but verify.”

One of the adorable annoyances of 4-year-olds is their persistent inquisitive nature. Why can’t I have another piece of cake? Why do I need to go to bed? Why can’t I have Froot Loops for dinner? Following the seemingly innocent and inquisitive strategies of a 4-year-old can help you dig deeply into problems and overcome preconceived notions of what is going on.
Here’s an example:
“10% of blood glucose meters are being rejected for rework at the Texas assembly facility.”
Ah ha! See how digging deeper revealed one possible cause? This technique can work quite well on many problems, but you also need to know when to stop. If you go too deep, you may actually lose focus! Also, take care not to jump to conclusions. In this case, it would seem that the higher defect rate at the Texas facility was caused by a cut in the travel budget and lack of training, but those factors may only partially account for the higher defect rate – there may be other forces at work.
Now that you have a list of probable causes, you need to narrow them down to the actual cause. This process of elimination must be verified with logic and fit the “footprint” of the symptoms. A theory about a cause will always have some hidden assumptions. Using the Texas facility example above, the assumption is that the problem is associated with lack of training. The theory is plausible, but you need more data to verify it. For instance, what is the expected “per piece” throughput of assembly line workers in Texas versus other facilities? How experienced and respected are the line supervisors in Texas versus other facilities? What set of parameters is the Texas facility using to approve products for release? You need to determine what data is needed to examine this in more detail.
Sometimes the best way to verify a probable cause is to implement a remedy and observe the results. In this case, sending the T&D Manager to the Texas facility to train the employees might be a good first step, followed by careful measurements of the subsequent rejection rates in that facility.
But use caution when using a trial-and-error approach to problem solving. Throwing money at a problem can be counterproductive and obviously expensive. You might be wrong.
Keep in mind that there are factors that can distort the results, including:
There are myriad ways you can plot your cause-and-effect data: scatter plot diagrams, Pareto charts, stratified frequency plots, “discrete C and continuous Y,” tree diagrams, and more.
These tools can help you visualize the data so you can spot patterns that otherwise would be difficult to see just by looking at numbers. The human brain is wired for pictures, not data, so use this basic fact to your advantage!
Consider the example below:
A manager in a call center of an insurance company wants to know why customers are complaining about the long time on they spend on hold. Using a histogram, the manager plots the data related to the last 150 calls placed to the call center. The result is presented below.
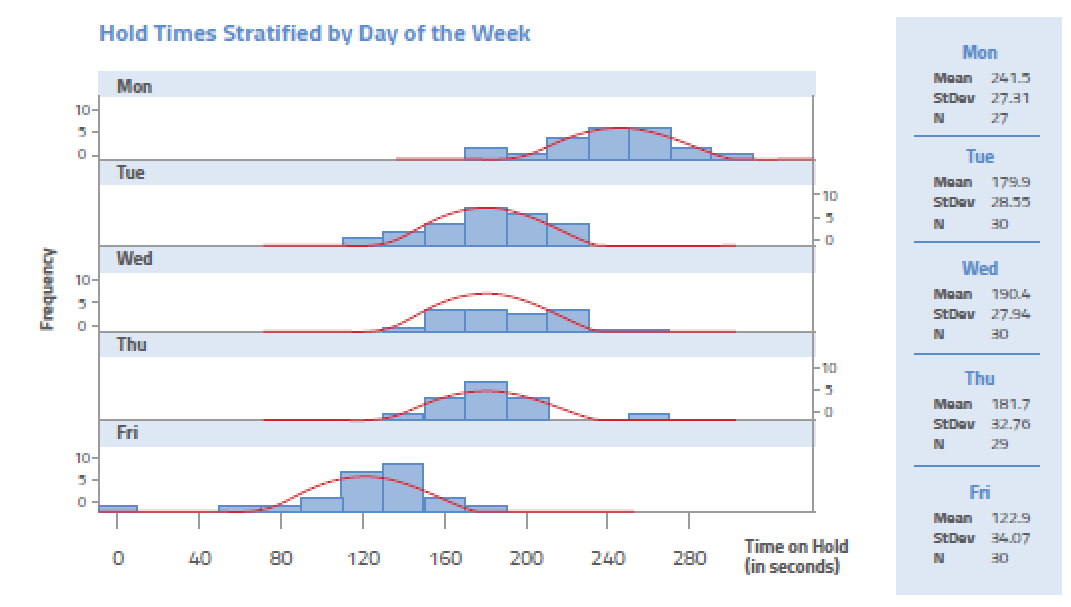
Interpreting the histogram, it is quite apparent that Monday is the worst day. But why? This will cause the manager to look at things such as volume of calls and staffing levels as the root cause journey continues.

US OfficeWashington DC
EU OfficeCork, Ireland